Direct link to the run statistics: LAUP – Statistics
Content
- Runs
- Media
- Bounding boxes
The statistics page is reserved for administrators and provides an overview of the recording runs, the uploaded images and the detected bounding boxes. To the select the year for which the statistics are to displayed, you can use the “Reporting year” drop-down menu.
Runs
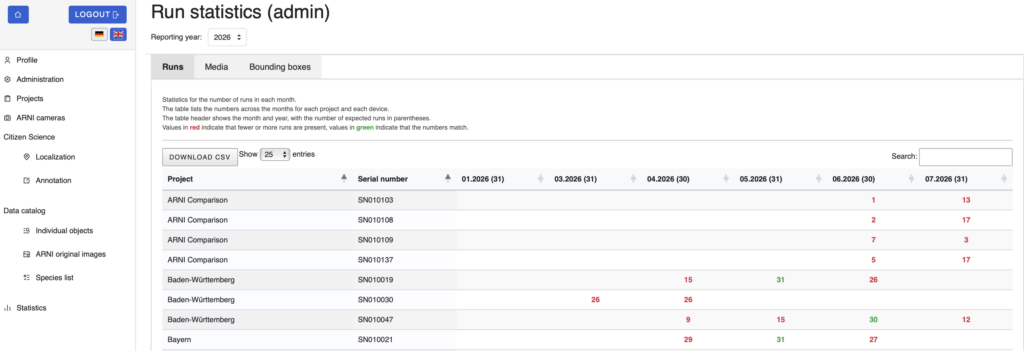
The “Runs” tab shows the number of the recording runs per month, broken down by project and serial number. The other columns in the table show the month and year, with the number of expected runs shown in brackets. Numbers in red indicate that there are fewer or more runs than expected, whilst numbers in green indicate that the number match. The table can be filtered by using the search function and the number of rows displayed can be adjusted. The table can be exported via “Download CSV”.
Media
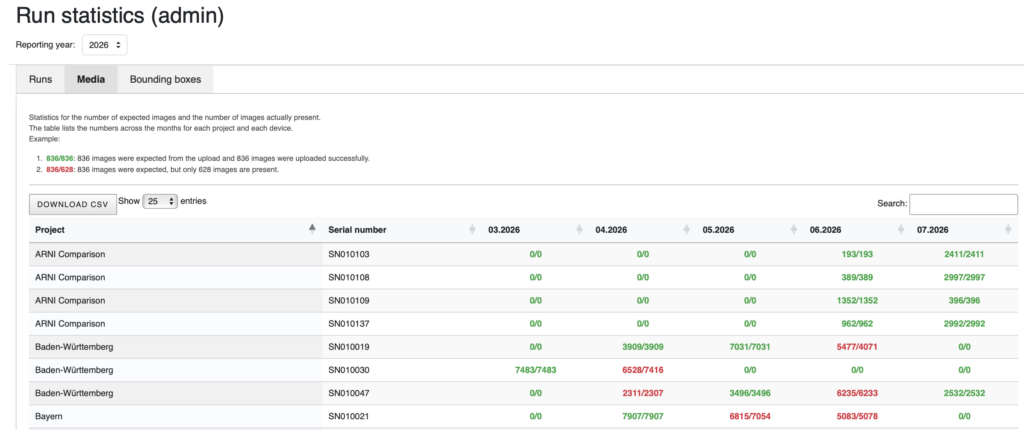
The “Media” tab shows the number of expected and actual images, also broken down by project, serial number and month. The values are displayed in the format "expected/present", with green indicating a match and red indicating a discrepancy. Search, row count and CSV export functions are also available here.
Bounding boxes
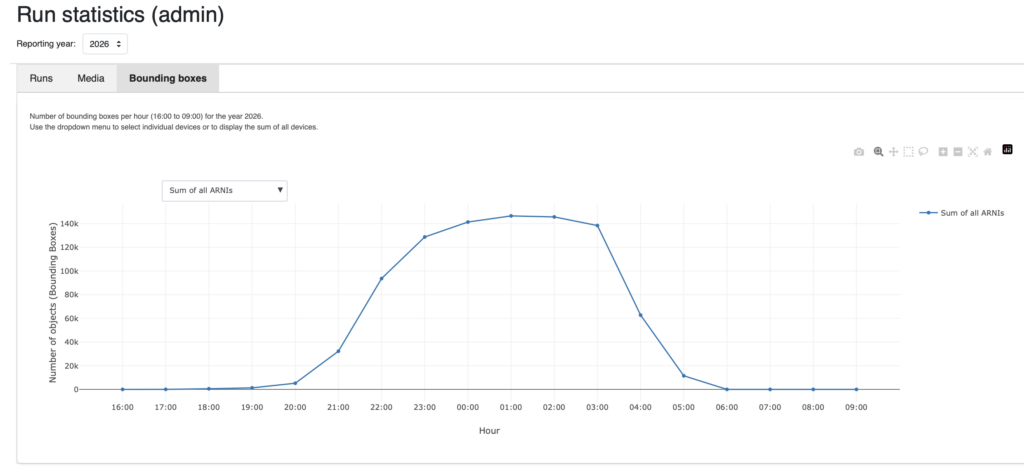
Under “Bounding boxes”, the number of detected bounding boxes per hour (4pm to 9 am) for the selected year is displayed as a line chart. By using the drop-down menu, individual ARNIs can be selected or the total for all ARNIs can be displayed.